Weathering an Old Cliff – Mar. 27, 2026
The weathering of an old cliff
The Catskill Geologists
Robert and Johanna Titus
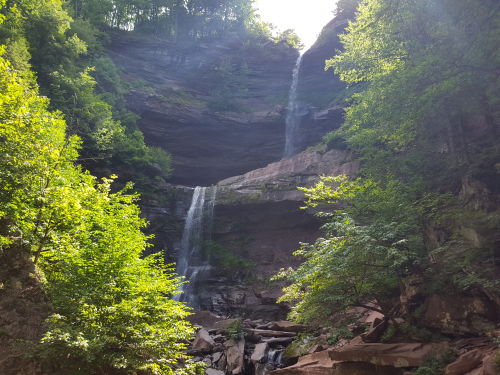
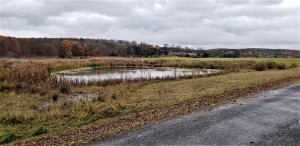
In recent columns we have been describing the many processes of the weathering and erosion of rock and would like to continue that today. Our goals, as almost always, are to train your eyes so you can take note of geological features that are all around you everywhere you go. Take a look at our photo. It was sent to us by a reader who calls himself “Mountain Mike.” He took the shot at the bottom of Kaaterskill Clove. Our reader was curious about those loose boulders lying at the bottom of the cliff on the lower right. How, he wondered, had they come about getting where they are? The answer to that question takes us back to the processes of weathering.
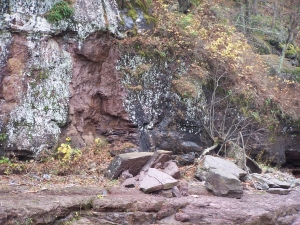
We rather suppose that if we could go there and find those boulders (and if we were a lot stronger than we actually are!) then we could lift them up and fit them back into the sandstone ledge that rises above them. In short, we think that they broke loose and tumbled down to where they are and those were probably recent events. That involves the physical breaking up of bedrock. How, exactly, did that happen?
There are two broad categories of weathering. The first and most important is called chemical weathering. We have been describing some of those in recent columns. They are chemical processes that break rocks down chemically and weather them away. The other big category is physical weathering. Physical processes break up rocks into fragments and crumble them away. Physical processes get us back to Mountain Mike’s rocks in Kaaterskill Clove.
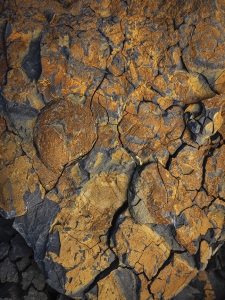
We think that what happened here is called freeze-thaw activity. That all begins with the simple fracturing of bedrock. In Kaaterskill Clove that’s easy. The bedrock of steep cliffs is always leaning toward the bottom of the clove. Stresses result, cracks form and these initiate further physical weathering. It is inevitable that at least some rainwater will seep into the fractures. And it is also inevitable that, come winter, that water will freeze. That’s the important part. You see as water freezes it also expands and that is always by exactly 9%. A cubic centimeter of water will turn into exactly 1.09 cubic centimeters of ice. There is some debate here but the long and the short of it is that expanding ice will do two things to those original fractures. They will become wider and they will become longer. In short freeze thaw is a process that breaks up rock.
To make it all the worse the process is a cyclical one. Freeze thaw processes are likely to occur in daily cycles, especially in late winter and early spring. That’s when the daytime sun is quite likely to warm up bedrock to well above freezing. But the following night’s cold will take the same watery rocks and refreeze them. During nights waters will freeze, expand and induce the fracturing of the rock. The next warm day will see the ice melt; more water will seep into the fractures and set it up for further disintegration. It’s a virtually endless process. And it’s an effective one, especially at this time of the year.
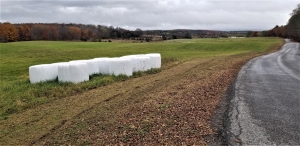
Here’s the “trained eyes” part: Watch, in coming weeks, for the “appearances” of rocks and boulders at the bases of outcrops along the sides of roads.
Contact the authors at randjtitus@prodigy.net. Join their facebook page “The Catskill Geologist.” Read their blogs at “thecatskillgeologist.com.”
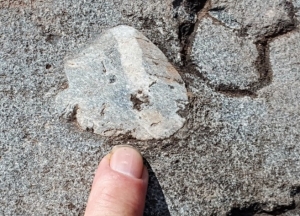
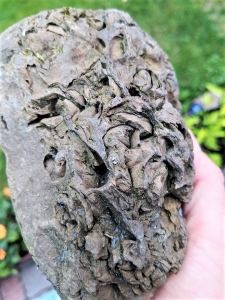
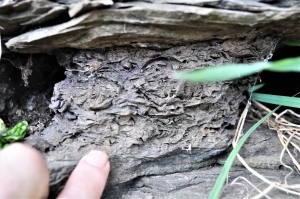 onian time period, and this rock is about 380 million years old, brachiopods were the most common forms of life. This rock is a petrifaction from one of those Devonian sea floors. But why is there such a dense jumble of brachiopods in this rock? We can never know for sure, but we can hypothesize. We have seen a lot of similar rocks in the Morris region, so we know a good bit about such sea floors. And “jumbles,” like this one, are common.